Using HAL lincurve and offset to correct for a not-so-straight axis
- finnstrom
-
 Topic Author
- Offline
- New Member
-

Less
More
- Posts: 15
- Thank you received: 4
28 Feb 2024 07:10 #294669
by finnstrom
Using HAL lincurve and offset to correct for a not-so-straight axis was created by finnstrom
I built my own CNC router with the long axis (I called it X for various reasons) at about 2.7m. It's all on 8020 profile and no matter how I tweaked it, I could never get the gantry to move in a straight line. It would shift reliably +/- 0.1mm (or about 0.005in), so I had an accuracy problem that was too large for my liking.
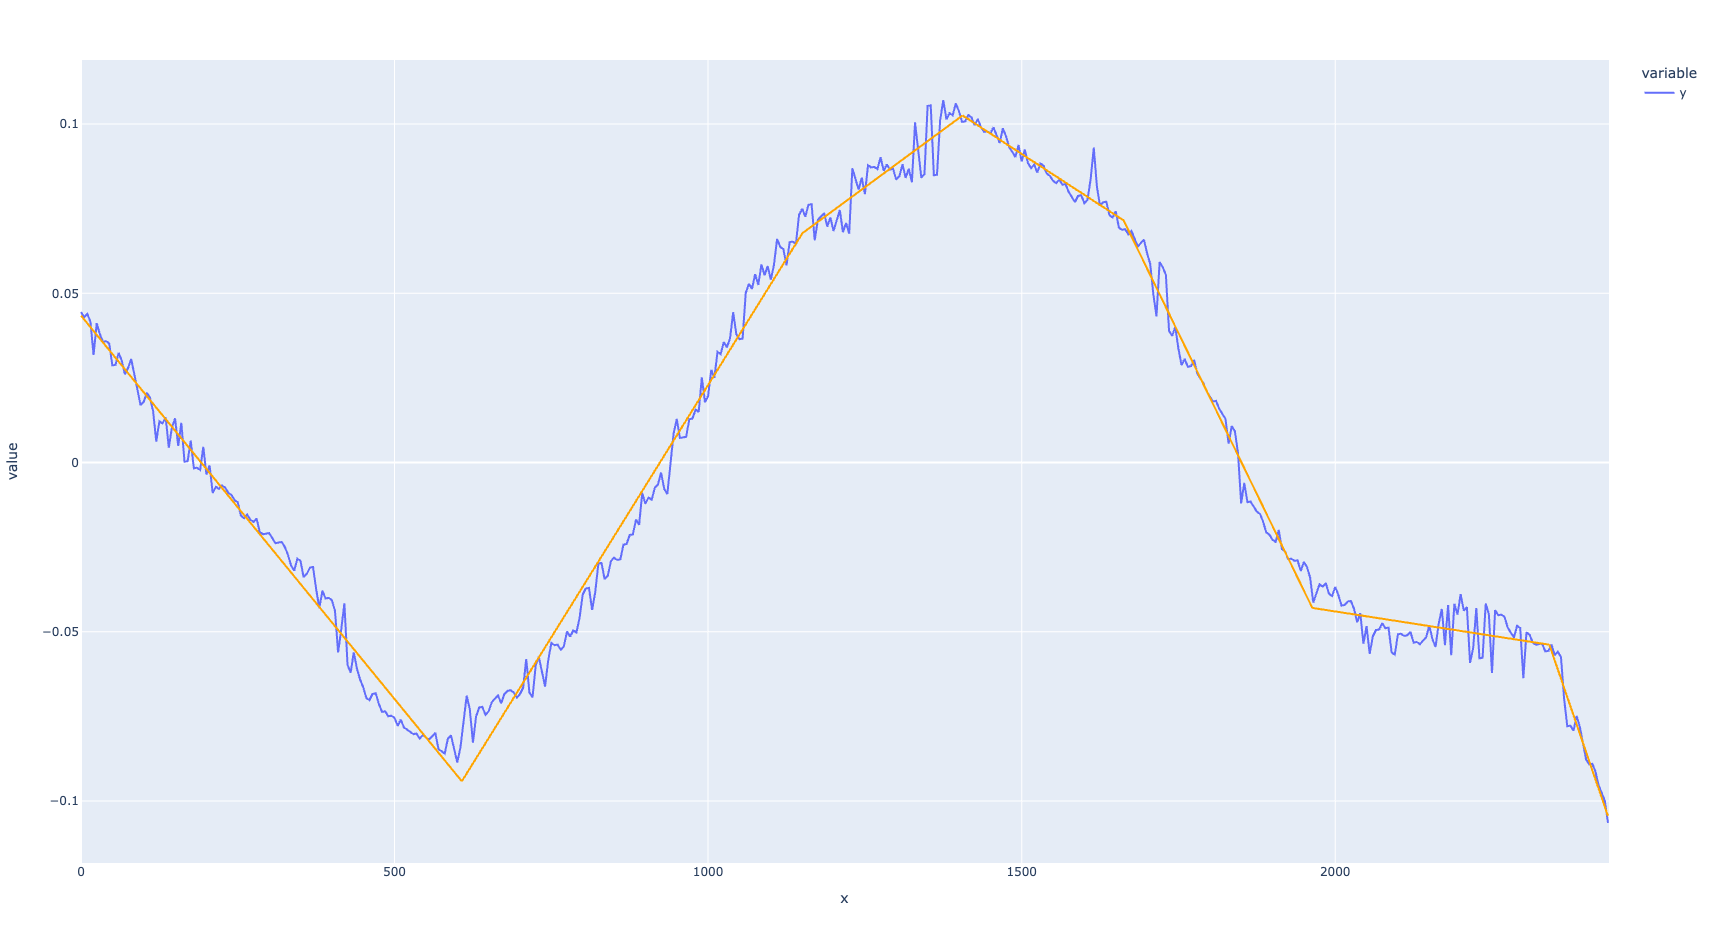
I got this same plot over and over at multiple Y locations, so lincurve would be a good solution here together with offset .
Essentially, lincurve lets you define an equation of sorts, then lets you map the x value to the y value. In this case, I would map the input of my X of where the spindle is to the output offset I want to move my Y axis. The reverse of the error you see in the graph above. Then I use that offset and implement it in the controller using HAL offset.
The "equation" that you give lincurve however is not your usual y=f(x), but multiple points (up to 16) on the x,y graph. The lincurve link above explains it better than I would.
Here is a snippet from my HAL:
And voila:
I got this same plot over and over at multiple Y locations, so lincurve would be a good solution here together with offset .
Essentially, lincurve lets you define an equation of sorts, then lets you map the x value to the y value. In this case, I would map the input of my X of where the spindle is to the output offset I want to move my Y axis. The reverse of the error you see in the graph above. Then I use that offset and implement it in the controller using HAL offset.
The "equation" that you give lincurve however is not your usual y=f(x), but multiple points (up to 16) on the x,y graph. The lincurve link above explains it better than I would.
Here is a snippet from my HAL:
net y-index-enable => pid.y.index-enable
net y-enable => pid.y.enable
net y-pos-cmd => pid.y.command
net y-pos-fb => pid.y.feedback
net y-output <= pid.y.output

# Step Gen signals/setup
setp hm2_7i76e.0.stepgen.01.dirsetup [JOINT_2]DIRSETUP
setp hm2_7i76e.0.stepgen.01.dirhold [JOINT_2]DIRHOLD
setp hm2_7i76e.0.stepgen.01.steplen [JOINT_2]STEPLEN
setp hm2_7i76e.0.stepgen.01.stepspace [JOINT_2]STEPSPACE
setp hm2_7i76e.0.stepgen.01.position-scale [JOINT_2]STEP_SCALE
setp hm2_7i76e.0.stepgen.01.step_type 0
setp hm2_7i76e.0.stepgen.01.control-type 1
setp hm2_7i76e.0.stepgen.01.maxaccel [JOINT_2]STEPGEN_MAXACCEL
setp hm2_7i76e.0.stepgen.01.maxvel [JOINT_2]STEPGEN_MAXVEL

# ---closedloop stepper signals---
# Alter Y position dependent on X position in order to straighten X axis
setp x_straight.x-val-00 0.0
setp x_straight.y-val-00 0.04341242632711628
setp x_straight.x-val-01 607.2917010709281
setp x_straight.y-val-01 -0.0941465387965644
setp x_straight.x-val-02 1150.4857125892602
setp x_straight.y-val-02 0.06777797847289474
setp x_straight.x-val-03 1405.8006869324868
setp x_straight.y-val-03 0.10253790211206171
setp x_straight.x-val-04 1662.603323359967
setp x_straight.y-val-04 0.07153820324398952
setp x_straight.x-val-05 1963.5065299510084
setp x_straight.y-val-05 -0.04292886830166562
setp x_straight.x-val-06 2341.4825252892224
setp x_straight.y-val-06 -0.053798901184427095
setp x_straight.x-val-07 2435.0
setp x_straight.y-val-07 -0.10441928397325695
net x-pos-fb => x_straight.in
net y-offset <= x_straight.out
net y-offset => x_straight_offset.offset
net y-pos-cmd-raw <= joint.2.motor-pos-cmd
net y-pos-cmd-raw => x_straight_offset.in
net y-pos-fb-raw <= hm2_7i76e.0.stepgen.01.position-fb
net y-pos-fb-raw => x_straight_offset.fb-in

net y-pos-cmd <= x_straight_offset.out
net y-vel-cmd <= joint.2.vel-cmd
net y-output => hm2_7i76e.0.stepgen.01.velocity-cmd
net y-pos-fb <= x_straight_offset.fb-out
net y-pos-fb => joint.2.motor-pos-fb
net y-enable <= joint.2.amp-enable-out
net y-enable => hm2_7i76e.0.stepgen.01.enable
And voila:
Attachments:
Please Log in or Create an account to join the conversation.
- finnstrom
-
Topic Author
- Offline
- New Member
-
Less
More
- Posts: 15
- Thank you received: 4
28 Feb 2024 07:19 #294670
by finnstrom
Replied by finnstrom on topic Using HAL lincurve and offset to correct for a not-so-straight axis
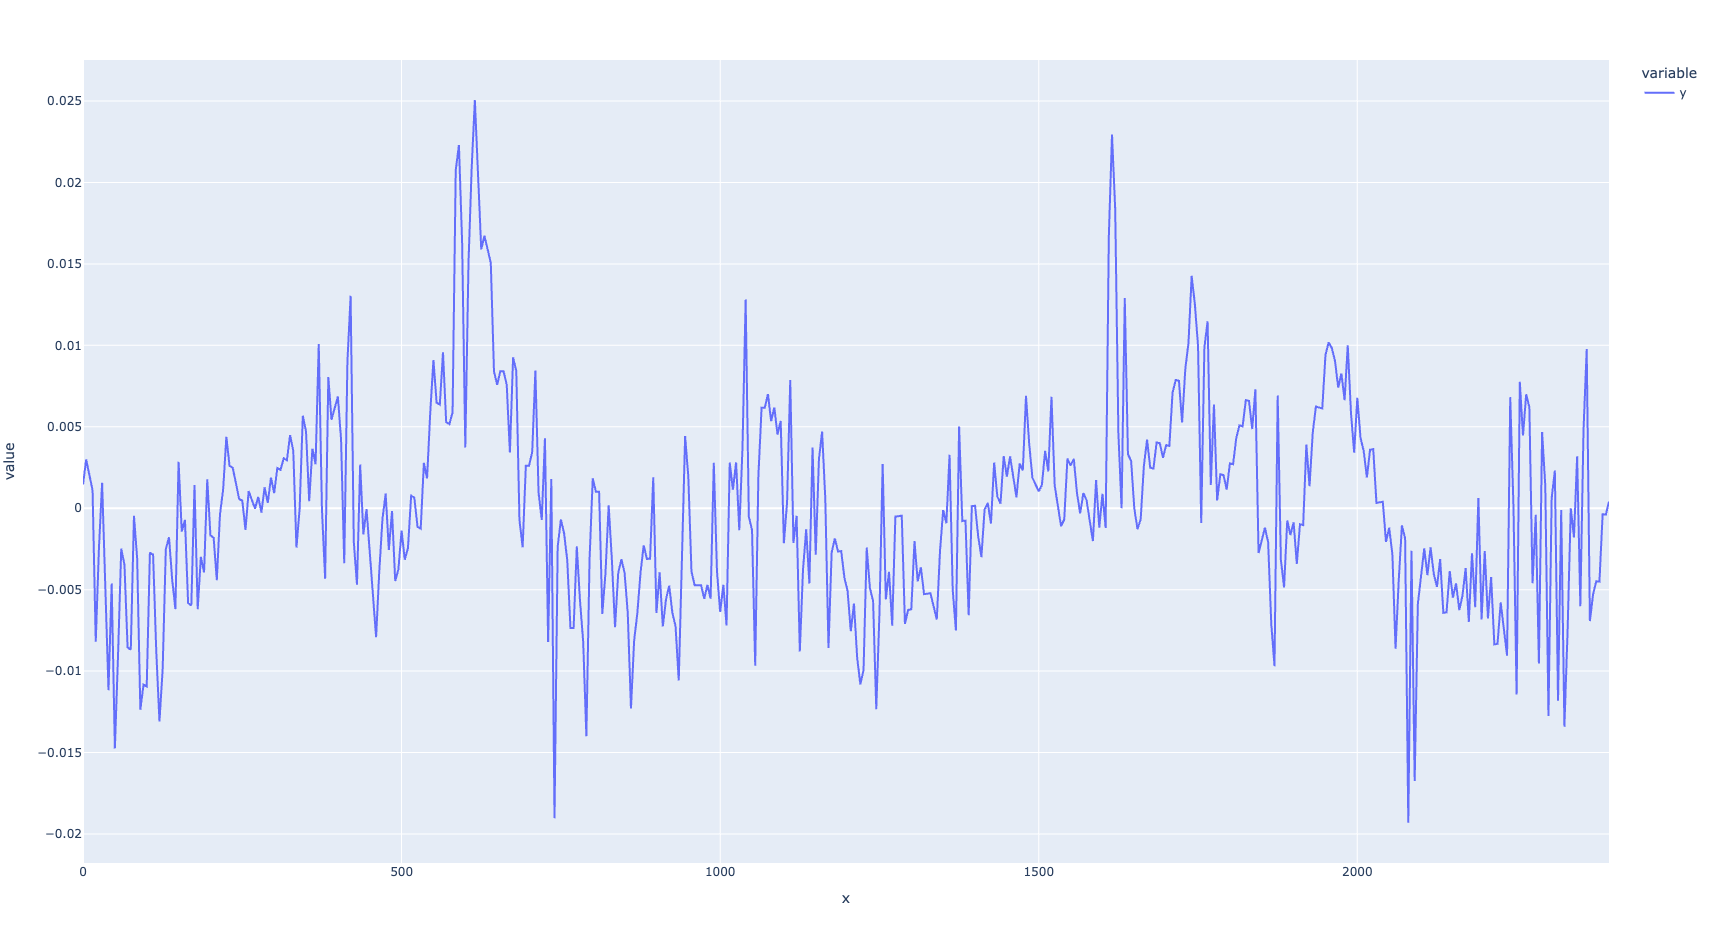
lincurve requires multiple linear regressions (up to 16-1=15) that have the constraint that all regression lines meet at their ends. For this minimization problem I used the python
piecewise linear fitting library
.
Broken down, you give it the x,y data, and in this case tell it how many breakpoints you want (for lincurve we can go up to 15), and if you have enough datapoints you usually get a globally minimum solution.
Here's the python code:
Just pip install the dependencies at the top. All my python is for 3, I haven't tested it on 2.
The datafile is generated from an ngc probing routine I wrote, and needs to look like a CSV (cut short for visibility) for the program above to read it correctly:
Broken down, you give it the x,y data, and in this case tell it how many breakpoints you want (for lincurve we can go up to 15), and if you have enough datapoints you usually get a globally minimum solution.
Here's the python code:
from absl import app
from absl import flags
import pandas as pd
from sklearn.linear_model import LinearRegression
import plotly.express as px
import pwlf

_MIN = -74.0
_MAX = 2450.0
_REGRESSION_SECTIONS = 5
FLAGS = flags.FLAGS
flags.DEFINE_string('data_file', '', 'Data file')
flags.DEFINE_string('data_file_comp', None, 'Data file to compare to')
def main(argv):
if FLAGS.data_file is None:
print('ERROR')
df = pd.read_csv(FLAGS.data_file)
# Calculate the total linear regression for plotting
model = LinearRegression()
model.fit(df[['x']], df[['y']])
df['y'] = df['y'] - model.intercept_ - df['x'] * model.coef_[0][0]
df['x'] = df['x'] - df['x'][0]
# initialize piecewise linear fit with your x and y data
my_pwlf = pwlf.PiecewiseLinFit(df['x'].to_numpy(), df['y'].to_numpy())
# Fit the data for line segments
regression = my_pwlf.fit(_REGRESSION_SECTIONS)
slope = my_pwlf.calc_slopes()
intercept = my_pwlf.intercepts
# Data file to compare to
if FLAGS.data_file_comp is not None:
df_comp = pd.read_csv(FLAGS.data_file_comp)
df_comp['y'] = df_comp['y'] - model.intercept_ - df_comp['x'] * model.coef_[0][0]
df_comp['x'] = df_comp['x'] - df_comp['x'][0]
df_comp = df_comp.rename(columns={'y': 'y_comp'})
df = pd.concat([df, df_comp])
df = pd.melt(df, id_vars=['x'], value_vars=['y', 'y_comp'])
else:
df = pd.melt(df, id_vars=['x'], value_vars=['y'])
# Plot
fig = px.line(df, x='x', y='value', color='variable')
regression_i = 0
while regression_i < _REGRESSION_SECTIONS:
fig.add_shape(
type="line",
x0=regression[regression_i],
y0=regression[regression_i] * slope[regression_i] + intercept[regression_i],
x1=regression[regression_i + 1],
y1=regression[regression_i + 1] * slope[regression_i] + intercept[regression_i],
line=dict(width=2, dash="solid", color="Orange",),
)
print(f"setp x_straight.x-val-{regression_i:02d} {regression[regression_i]}")
print(f"setp x_straight.y-val-{regression_i:02d} {regression[regression_i] * slope[regression_i] + intercept[regression_i]}")
regression_i = regression_i + 1
print(f"setp x_straight.x-val-{regression_i:02d} {regression[regression_i]}")
print(f"setp x_straight.y-val-{regression_i:02d} {regression[regression_i] * slope[regression_i - 1] + intercept[regression_i - 1]}")
fig.show()

if __name__ == '__main__':
app.run(main)
Just pip install the dependencies at the top. All my python is for 3, I haven't tested it on 2.
The datafile is generated from an ngc probing routine I wrote, and needs to look like a CSV (cut short for visibility) for the program above to read it correctly:
x,y
5.000000,1161.072689
10.000000,1161.074890
15.000000,1161.074590
20.000000,1161.074291
25.000000,1161.065659
30.000000,1161.072027
The following user(s) said Thank You: tommylight
Please Log in or Create an account to join the conversation.
- DEVILHUNTER
- Offline
- Junior Member
-

Less
More
- Posts: 31
- Thank you received: 11
10 May 2024 05:09 #300289
by DEVILHUNTER
Replied by DEVILHUNTER on topic Using HAL lincurve and offset to correct for a not-so-straight axis
Really cool, and usefull. I have created a similar software as had the same problem on my machine. In my case I created a kinematics component (so I couold correct errors in all axis) that takes a lookup table for each error and correct the perpendicular axis. The lookup table is set every milimeter of machine movement, so you get really smooth curve. To creat the lookup table just take a bunch of measurements and interpolated it externally, so you can get the number of measurements you want and use a polynomial interpolation.
On the Z axis, the most problematic one if the guides are not straight, it also takes into account the angle created by the guides and the distance to the tool tip. This way we correct the biggest error point that is located in the tool tip (and is different for each tool lenght).
In the end I got my machine mechanically in 0.02mm in the tool tip so I didn't even tested the software. But I think this could be interesting to implement, as industrial controls have software compensation for small errors too.
Please Log in or Create an account to join the conversation.
Time to create page: 0.295 seconds