LinuxCNC pyton debugging with pycharm
- MatthiasF1210
- Offline
- Junior Member
-

Less
More
- Posts: 38
- Thank you received: 0
03 Jan 2019 09:44 #123399
by MatthiasF1210
LinuxCNC pyton debugging with pycharm was created by MatthiasF1210
Hi,
I know there have been discussed a lot Topics around pycharm already, but I couldn't find an answer so for to my specific question.
I am running LinuxCNC 2.7 build from source and as "run in place" version. I installed pycharm and set up all the paths. When starting LinuxCNC from the shell I execute like this
Then I tried out a little example from python interface
This works well, I can debug as I want.

What I wonder now is, how to get it work with a linuxcnc GUI Interaction.
I want to debug code like this
So the code is just executed after the user has pressed a button (on_down_released). When I use a breakpoint in there, nothings happens. I tried already to start linuxcnc from inside the pycharm terminal, but no effect.
At this point I have no idea how to go on.
Thanks for some help
Matthias
I know there have been discussed a lot Topics around pycharm already, but I couldn't find an answer so for to my specific question.
I am running LinuxCNC 2.7 build from source and as "run in place" version. I installed pycharm and set up all the paths. When starting LinuxCNC from the shell I execute like this
linuxcnc-vm@linuxcnc:~/linuxcnc-dev$ . scripts/rip-environment
linuxcnc-vm@linuxcnc:~/linuxcnc-dev$ linuxcnc
Then I tried out a little example from python interface
import sys
import linuxcnc
try:
    s = linuxcnc.stat() # create a connection to the status channel
    s.poll() # get current values
except linuxcnc.error, detail:
    print "error", detail
    sys.exit(1)
for x in dir(s):
    if not x.startswith('_'):
        print x, getattr(s,x)
This works well, I can debug as I want.
What I wonder now is, how to get it work with a linuxcnc GUI Interaction.
I want to debug code like this
# Down
    def on_down_released(self, gtkbutton, data = None):
        self.command.mode( linuxcnc.MODE_MDI )
        self.command.wait_complete()
        # Start down.ngc
        if self.ocode ("O<down> call") == -1:
            return
        a=self.probed_position_with_offsets()
        self.lb_probe_z.set_text( "%.4f" % float(a[2]) )
        self.add_history(gtkbutton.get_tooltip_text(),"Z",0,0,0,0,0,0,0,0,a[2],0,0)
        self.set_zerro("Z",0,0,a[2])
So the code is just executed after the user has pressed a button (on_down_released). When I use a breakpoint in there, nothings happens. I tried already to start linuxcnc from inside the pycharm terminal, but no effect.
At this point I have no idea how to go on.
Thanks for some help
Matthias
Attachments:
Please Log in or Create an account to join the conversation.
- cmorley
- Away
- Moderator
-

Less
More
- Posts: 7342
- Thank you received: 2164
03 Jan 2019 10:15 #123400
by cmorley
Replied by cmorley on topic LinuxCNC pyton debugging with pycharm
I don't know anything about pycharm but...
you could debug in the terminal by adding :
import pdb; pdb.set_trace()
to the program where you want to debug.
docs.python.org/2/library/pdb.html
Can you connect pycharm by using program PID number?
The program you are debugging is actually gladevcp, so maybe you could get the PID number for it...
Chris M
Please Log in or Create an account to join the conversation.
- MatthiasF1210
- Offline
- Junior Member
-
Less
More
- Posts: 38
- Thank you received: 0
03 Jan 2019 20:19 #123424
by MatthiasF1210
Replied by MatthiasF1210 on topic LinuxCNC pyton debugging with pycharm
Hi Chris,
thanks for that hint. I tried pdb in my script and it worked as you described. But tu me it looks not very easy in the usage.
You do all your debugging in the terminal? I am not sticking to pycharm, but I am looking for an IDE with a minimum comfort for programming and debugging.
Any suggestions?
Greetings
Matthias
Please Log in or Create an account to join the conversation.
- cmorley
- Away
- Moderator
-
Less
More
- Posts: 7342
- Thank you received: 2164
04 Jan 2019 00:23 #123441
by cmorley
Replied by cmorley on topic LinuxCNC pyton debugging with pycharm
I'm a wierdo - I do all my programming without an IDE.
I do all python debugging with print statements and pdb.
Chris M
I do all python debugging with print statements and pdb.
Chris M
Please Log in or Create an account to join the conversation.
- tommylight
-

- Offline
- Moderator
-
Less
More
- Posts: 21762
- Thank you received: 7436
04 Jan 2019 20:03 #123498
by tommylight
")
Replied by tommylight on topic LinuxCNC pyton debugging with pycharm
And we like you as such !I'm a wierdo
Chris M
Please Log in or Create an account to join the conversation.
- MatthiasF1210
- Offline
- Junior Member
-
Less
More
- Posts: 38
- Thank you received: 0
06 Jan 2019 10:50 #123595
by MatthiasF1210
Replied by MatthiasF1210 on topic LinuxCNC pyton debugging with pycharm
Hi all,
I just search a lot in the net with your hint of using "pdb" for debugging and found 2 things which are interesting
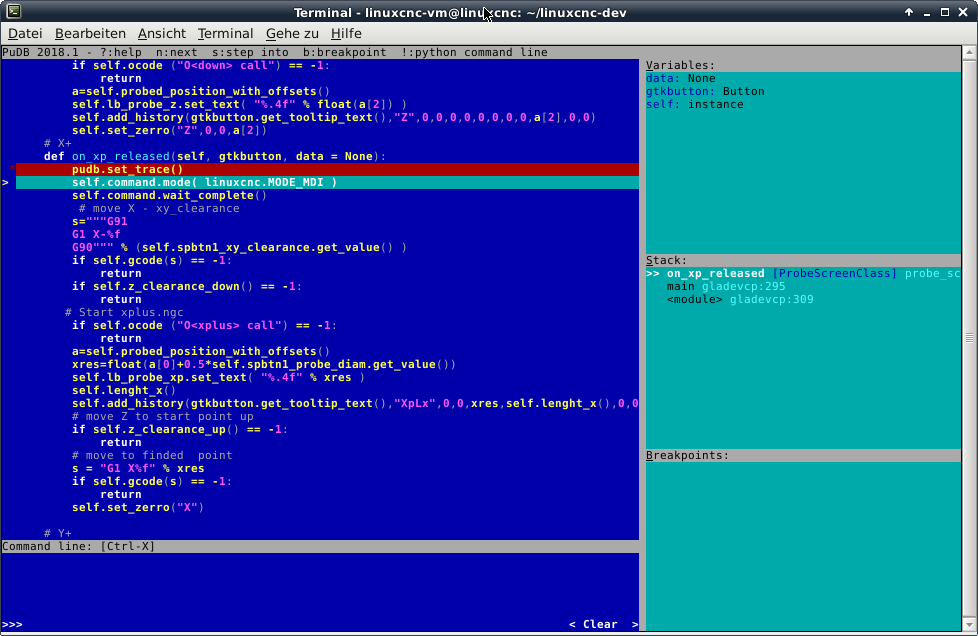
1. pudb
This is similar in the usage as pdb, just provides some graphical support. Just usein the code and start linuxcnc from the terminal. Inside the terminal you will get this
2. pycharm debug "Attach to process"
Pycharm has the possibility to attach to any py process on the computer
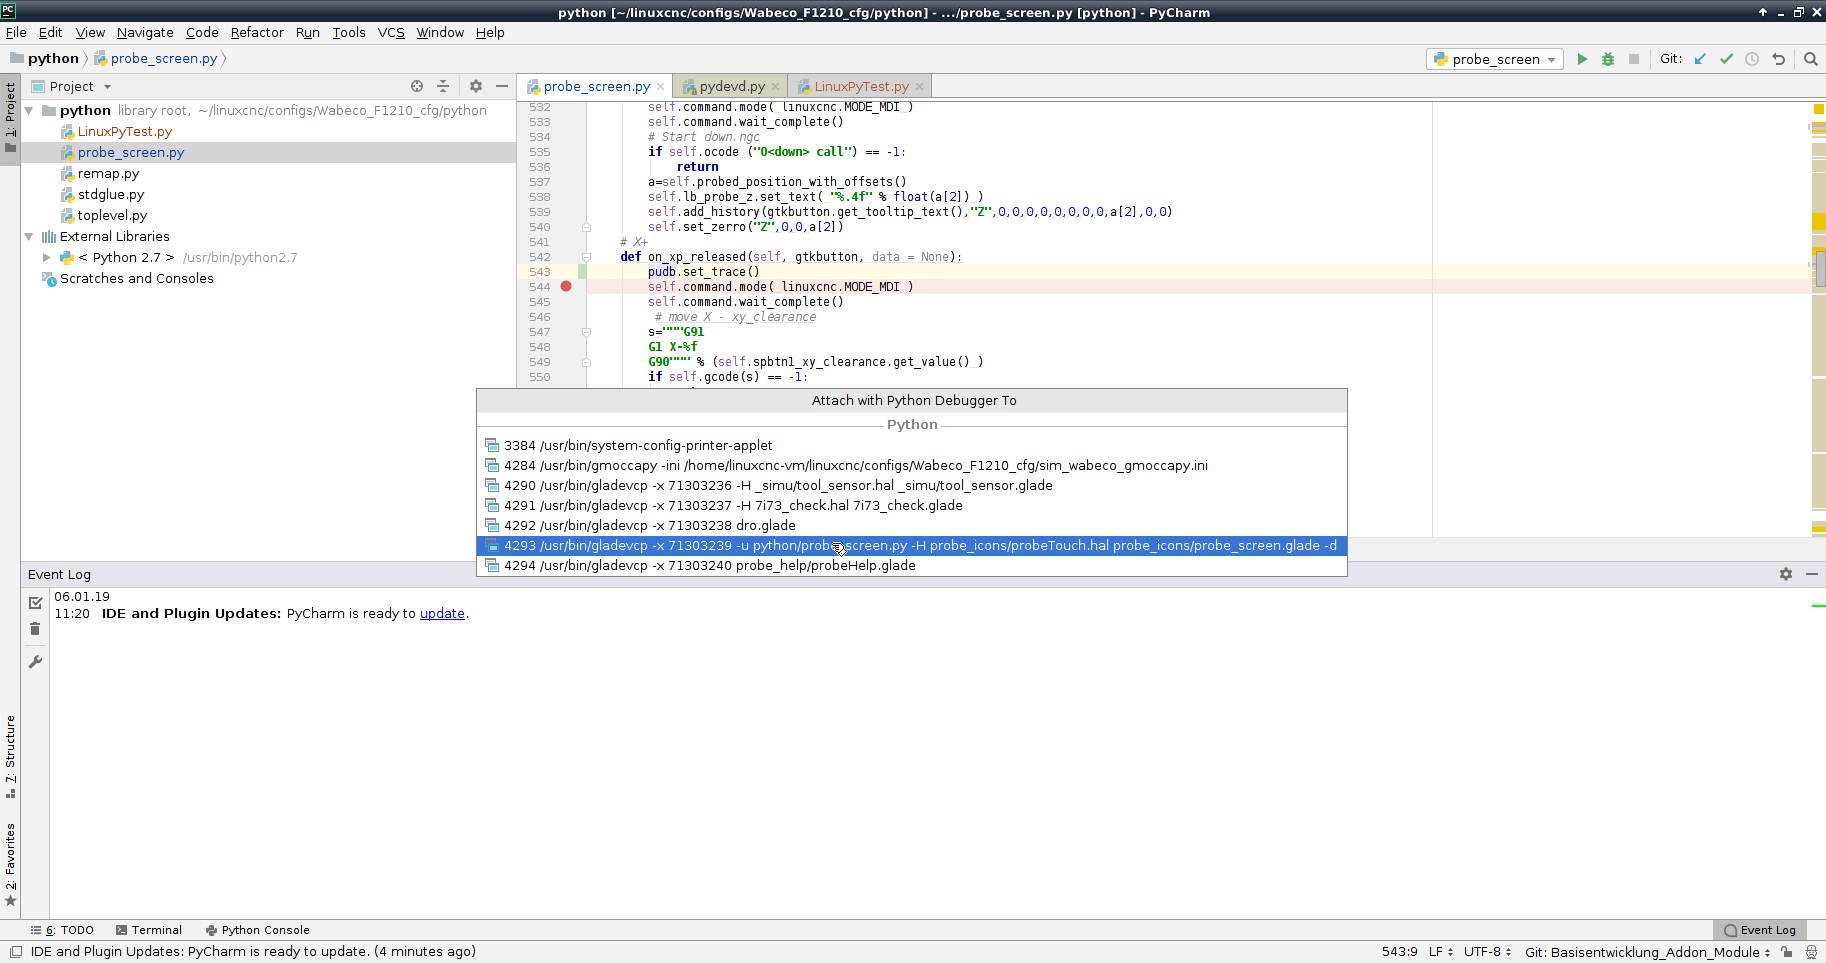
But this doesn't work on may current VirtualMachine. It seems that I can not work at all with the RTAI kernel.
Another Question:
As I want to debug py files which are loaded from gladevcp I wonder if I always have to restart linuxcnc after I changed something in the py file.
Thanks so far
Matthias
I just search a lot in the net with your hint of using "pdb" for debugging and found 2 things which are interesting
1. pudb
This is similar in the usage as pdb, just provides some graphical support. Just use
import pudb
pudb.set_trace() # at the position you want to break
2. pycharm debug "Attach to process"
Pycharm has the possibility to attach to any py process on the computer
But this doesn't work on may current VirtualMachine. It seems that I can not work at all with the RTAI kernel.
Another Question:
As I want to debug py files which are loaded from gladevcp I wonder if I always have to restart linuxcnc after I changed something in the py file.
Thanks so far
Matthias
Please Log in or Create an account to join the conversation.
Time to create page: 0.142 seconds