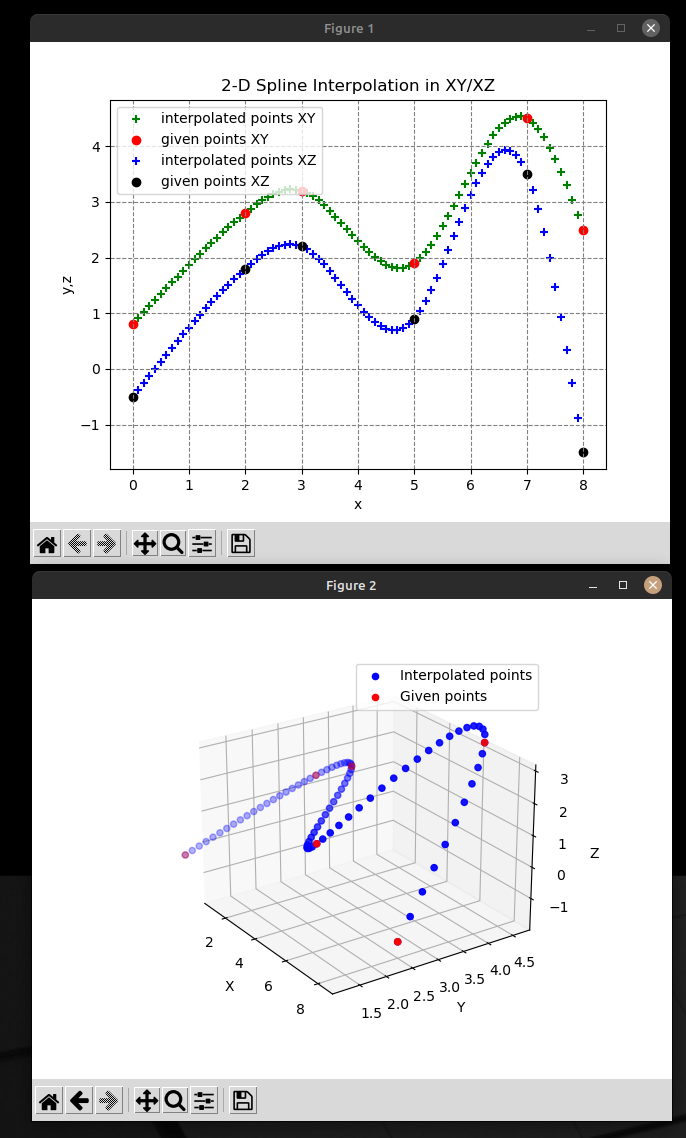
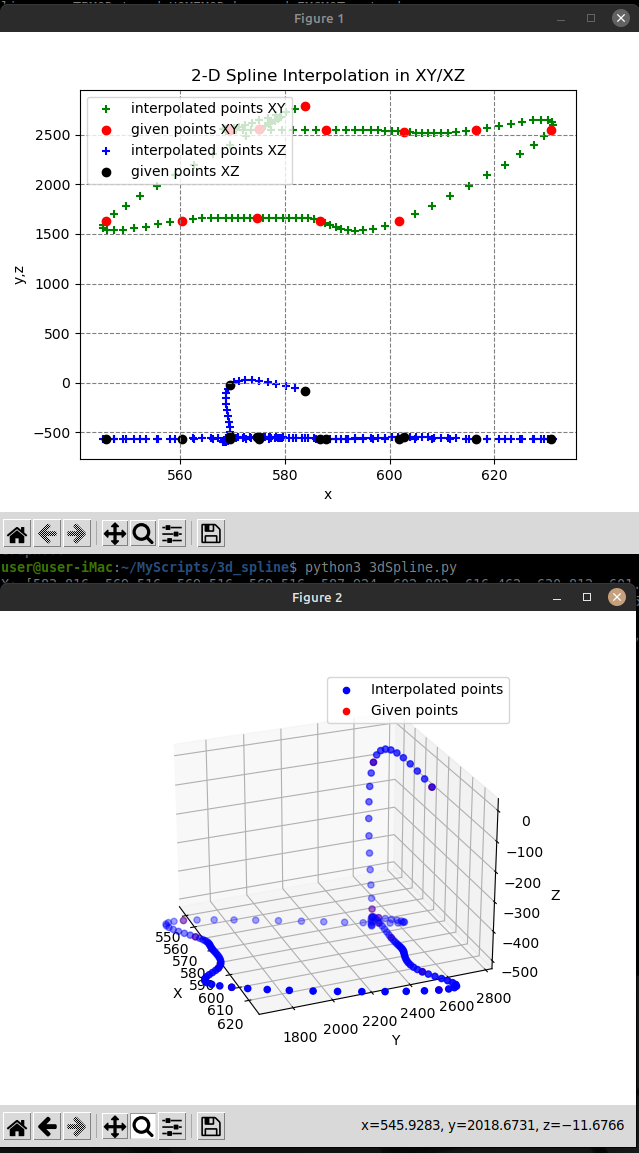
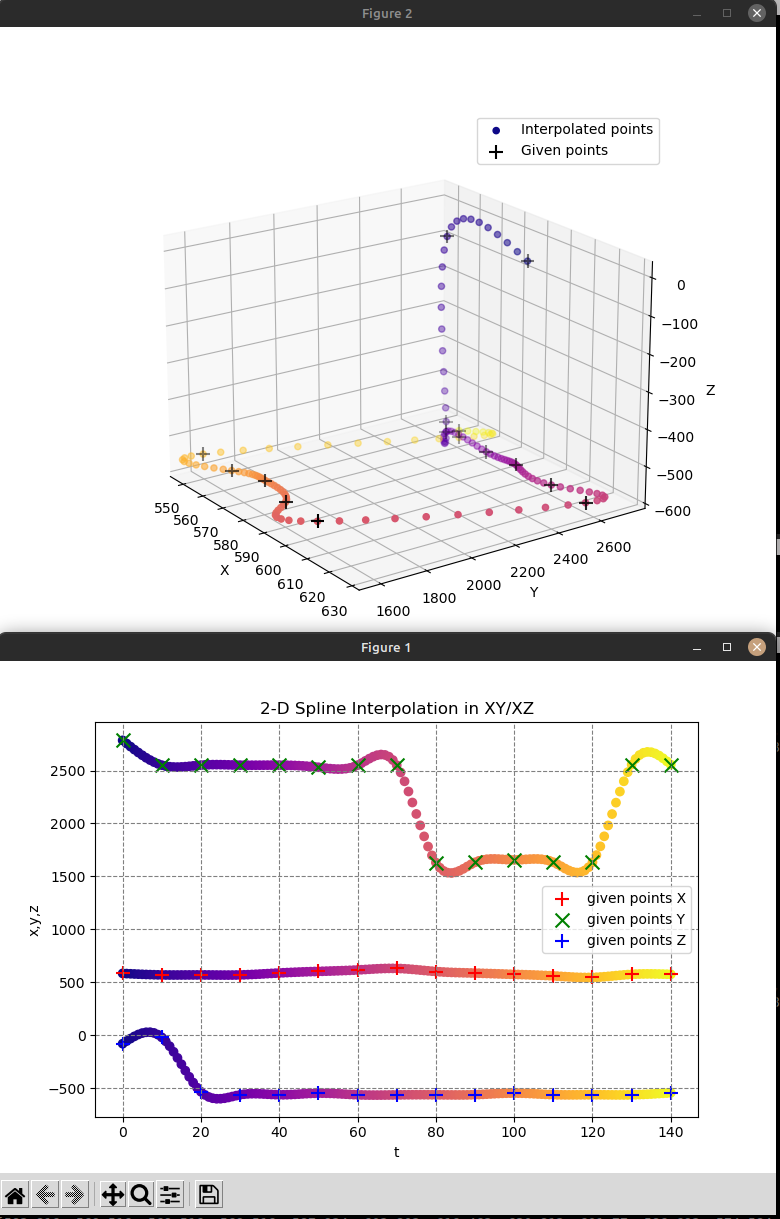
Modified the script to accept any sequence of point coordinates (x,y,z) read from a file called 'points_input.txt' in the same directory as the '3dSpline.py' script and outputs the interpolated points to a file called 'output_file.txt':
Code:
#! /usr/local/bin/python3.6
"""
3-D spline interpolation
(with graph drawing by matplotlib)
"""
import matplotlib.pyplot as plt
import sys
import os
import traceback
class SplineInterpolation:
def __init__(self, ts, ds):
""" Initialization
:param list ts: item number list of given points
:param list ds: coordinate list of given points
"""
self.ts, self.ds = ts, ds
self.n = len(self.ts) - 1
h = self.__calc_h()
w = self.__calc_w(h)
matrix = self.__gen_matrix(h, w)
v = [0] + self.__gauss_jordan(matrix) + [0]
self.b = self.__calc_b(v)
self.a = self.__calc_a(v)
self.d = self.__calc_d()
self.c = self.__calc_c(v)
def interpolate(self, t):
""" Interpolation
:param float t: value for a interpolate target
:return float : computated y-value
"""
try:
i = self.__search_i(t)
return self.a[i] * (t - self.ts[i]) ** 3 \
+ self.b[i] * (t - self.ts[i]) ** 2 \
+ self.c[i] * (t - self.ts[i]) \
+ self.d[i]
except Exception as e:
raise
def __calc_h(self):
""" H calculation
:return list: h-values
"""
try:
return [self.ts[i + 1] - self.ts[i] for i in range(self.n)]
except Exception as e:
raise
def __calc_w(self, h):
""" W calculation
:param list h: h-values
:return list : w-values
"""
try:
return [
6 * ((self.ds[i + 1] - self.ds[i]) / h[i]
- (self.ds[i] - self.ds[i - 1]) / h[i - 1])
for i in range(1, self.n)
]
except Exception as e:
raise
def __gen_matrix(self, h, w):
""" Matrix generation
:param list h: h-values
:param list w: w-values
:return list mtx: generated 2-D matrix
"""
mtx = [[0 for _ in range(self.n)] for _ in range(self.n - 1)]
try:
for i in range(self.n - 1):
mtx[i][i] = 2 * (h[i] + h[i + 1])
mtx[i][-1] = w[i]
if i == 0:
continue
mtx[i - 1][i] = h[i]
mtx[i][i - 1] = h[i]
return mtx
except Exception as e:
raise
def __gauss_jordan(self, matrix):
""" Solving of simultaneous linear equations
with Gauss-Jordan's method
:param list mtx: list of 2-D matrix
:return list v: answers list of simultaneous linear equations
"""
v = []
n = self.n - 1
try:
for k in range(n):
p = matrix[k][k]
for j in range(k, n + 1):
matrix[k][j] /= p
for i in range(n):
if i == k:
continue
d = matrix[i][k]
for j in range(k, n + 1):
matrix[i][j] -= d * matrix[k][j]
for row in matrix:
v.append(row[-1])
return v
except Exception as e:
raise
def __calc_a(self, v):
""" A calculation
:param list v: v-values
:return list : a-values
"""
try:
return [
(v[i + 1] - v[i])
/ (6 * (self.ts[i + 1] - self.ts[i]))
for i in range(self.n)
]
except Exception as e:
raise
def __calc_b(self, v):
""" B calculation
:param list v: v-values
:return list : b-values
"""
try:
return [v[i] / 2.0 for i in range(self.n)]
except Exception as e:
raise
def __calc_c(self, v):
""" C calculation
:param list v: v-values
:return list : c-values
"""
try:
return [
(self.ds[i + 1] - self.ds[i]) / (self.ts[i + 1] - self.ts[i]) \
- (self.ts[i + 1] - self.ts[i]) * (2 * v[i] + v[i + 1]) / 6
for i in range(self.n)
]
except Exception as e:
raise
def __calc_d(self):
""" D calculation
:return list: c-values
"""
try:
return self.ds
except Exception as e:
raise
def __search_i(self, t):
""" Index searching
:param float t: t-value
:return int i: index
"""
i, j = 0, len(self.ts) - 1
try:
while i < j:
k = (i + j) // 2
if self.ts[k] < t:
i = k + 1
else:
j = k
if i > 0:
i -= 1
return i
except Exception as e:
raise
class Graph:
def __init__(self, xs_0, ys_0, zs_0, xs_1, ys_1, zs_1):
self.xs_0, self.ys_0, self.zs_0, self.xs_1, self.ys_1, self.zs_1 = xs_0, ys_0, zs_0, xs_1, ys_1, zs_1
def plot2d(self):
try:
plt.title("2-D Spline Interpolation in XY/XZ")
plt.scatter(
self.xs_1, self.ys_1, c = "g",
label = "interpolated points XY", marker = "+"
)
plt.scatter(
self.xs_0, self.ys_0, c = "r",
label = "given points XY"
)
plt.scatter(
self.xs_1, self.zs_1, c = "b",
label = "interpolated points XZ", marker = "+"
)
plt.scatter(
self.xs_0, self.zs_0, c = "k",
label = "given points XZ"
)
plt.xlabel("x")
plt.ylabel("y,z")
plt.legend(loc = 2)
plt.grid(color = "gray", linestyle = "--")
#plt.show()
#plt.savefig("spline_interpolation.png")
except Exception as e:
raise
def plot3d(self):
ax = plt.figure().add_subplot(projection='3d')
x = self.xs_1
y = self.ys_1
z = self.zs_1
ax.scatter(x, y, z, c='b', label='Interpolated points')
ax.scatter(X, Y, Z, c='r', label='Given points')
# Make legend, set axes limits and labels
ax.legend()
ax.set_xlim(min(X),max(X))
ax.set_ylim(min(Y),max(Y))
ax.set_zlim(min(Z),max(Z))
ax.set_xlabel('X')
ax.set_ylabel('Y')
ax.set_zlabel('Z')
# Customize the view angle so it's easier to see that the scatter points lie
# on the plane y=0
ax.view_init(elev=20., azim=-35)
plt.show()
if __name__ == '__main__':
# (N + 1) points
T,X,Y,Z = [],[],[],[]
fileName = './points_input.txt'
import csv
with open(fileName, 'r') as f:
reader = csv.reader(f)
point_data = list(reader)
for line in point_data:
X.append(float(line[0]))
Y.append(float(line[1]))
Z.append(float(line[2]))
print('X:', X)
print('Y:', Y)
print('Z:', Z)
n=0
for x in X:
T.append(n+1.0)
n += 1
print('T: ', T)
#T = [1.0,2.0,3.0,4.0,5.0,6.0]
#X = [0.0, 2.0, 3.0, 5.0, 7.0, 8.0]
#Y = [0.8, 2.8, 3.2, 1.9, 4.5, 2.5]
#Z = [-0.5, 1.8, 2.2, 0.9, 3.5, -1.5]
S = 0.1 # Step for interpolation
S_1 = 1 / S # Inverse of S
xs_g, ys_g, zs_g = [], [], [] # List for graph
try:
# 3-D spline interpolation
si = SplineInterpolation(T, X)
for t in [t / S_1 for t in range(int(T[0] / S), int(T[-1] / S) + 1)]:
x= si.interpolate(t)
#print("{:8.4f}, {:8.4f}".format(t, x))
xs_g.append(x)
si = SplineInterpolation(T, Y)
for t in [t / S_1 for t in range(int(T[0] / S), int(T[-1] / S) + 1)]:
y = si.interpolate(t)
#print("{:8.4f}, {:8.4f}".format(t, y))
ys_g.append(y)
si = SplineInterpolation(T, Z)
for t in [t / S_1 for t in range(int(T[0] / S), int(T[-1] / S) + 1)]:
z = si.interpolate(t)
#print("{:8.4f}, {:8.4f}".format(t, z))
zs_g.append(z)
# Write output to file
file_out = 'output_file.txt'
print('Writing output to ',file_out)
n=0
output = open(file_out, 'w')
for x in xs_g:
string=("G0 X{:8.4f} Y{:8.4f} Z{:8.4f}\n".format(xs_g[n], ys_g[n], zs_g[n]))
output.write(string)
n += 1
# Closing file
output.close()
# Graph drawing
g = Graph(X, Y, Z, xs_g, ys_g, zs_g)
g.plot2d()
g.plot3d()
except Exception as e:
traceback.print_exc()
sys.exit(1)
Code:
[code]583.8160, 2785.3929, -80.0100,
569.5160, 2551.3630, -20.8590,
569.5160, 2551.3630, -534.4340,
569.5160, 2551.3630, -563.0960,
587.9240, 2551.3630, -562.6310,
602.8020, 2531.2934, -547.8260,
616.4620, 2550.4623, -563.0180,
630.8120, 2550.4623, -563.9780,
601.7700, 1631.0440, -563.0410,
586.6920, 1633.2648, -561.9940,
574.5840, 1656.0775, -546.8950,
560.3560, 1634.1061, -561.9290,
545.8120, 1634.7045, -562.6420,
575.0200, 2556.2819, -563.3090,
575.0200, 2556.2819, -543.9050,