random fails on latency tests
- tatel
- Offline
- Junior Member
-

Less
More
- Posts: 33
- Thank you received: 16
10 Jul 2022 19:54 #247037
by tatel
random fails on latency tests was created by tatel
I'm getting random fails with latency-histogram. Even on a fresh install --using RTAI-- it can take quite a bunch of seconds to start; then it shows min servo latencies of -24,7 usecs (base) and -999,7 usecs (servo). It doesn't updates for about other 40-50 seconds, the it starts to update and to throw messages
can't use non-numeric floating point value as operand of "*" (variance=-1521835223)
But sometimes it starts without any problem. Please see screenshot; there you can see how it's working fine just after killing a previous fail.
Tried latency-test. It started fine at first attempt then on another try got stuck signaling 0 usec latency. I tried latency-plot just once and it worked fine.
I noticed the same latency-histogram behavior in a previous custom install using Devuan Beowulf. There I added linuxcnc repos to sources.list.d/linuxcnc.list and installed kernel 4.19.195-rtai-amd64 and linuxcnc. On the live install of linuxcnc, I uninstalled linuxcnc-uspace, then installed kernel 4.19.195-rtai-amd64, linuxcnc and linuxcnc-dev
In both cases system was running the RTAI kernel
I'm attaching the output of halcmd show and linuxcnc_info
And here you can see the previously mentioned screenshot:
https://justpaste.it/827de
Attachments:
Please Log in or Create an account to join the conversation.
- tommylight
-

- Away
- Moderator
-

Less
More
- Posts: 21764
- Thank you received: 7438
10 Jul 2022 21:22 #247043
by tommylight
Replied by tommylight on topic random fails on latency tests
Upload the pictures here, please.
Did you disable hyperthreading and power saving features in BIOS?
RTAI 4.19 will refuse to work on some older hardware, it boots and everything works except the real time stuff, here are some examples:
forum.linuxcnc.org/18-computer/38838-har...ts-used-pc-s?start=0
Did you disable hyperthreading and power saving features in BIOS?
RTAI 4.19 will refuse to work on some older hardware, it boots and everything works except the real time stuff, here are some examples:
forum.linuxcnc.org/18-computer/38838-har...ts-used-pc-s?start=0
Please Log in or Create an account to join the conversation.
- tatel
- Offline
- Junior Member
-
Less
More
- Posts: 33
- Thank you received: 16
11 Jul 2022 04:59 - 11 Jul 2022 05:41 #247053
by tatel
Replied by tatel on topic random fails on latency tests
Not really much to do in this BIOS, but processor.max_cstate=0 and nosmt have worked wonders. No latency problems here, but latency test software problems. Since I got the same behavior twice in a row with two different distros, I tougt it could probably be worth to report it.
Not really sure about how to upload pictures to this forum, do you mean to attach them? Well I'm going to try ...
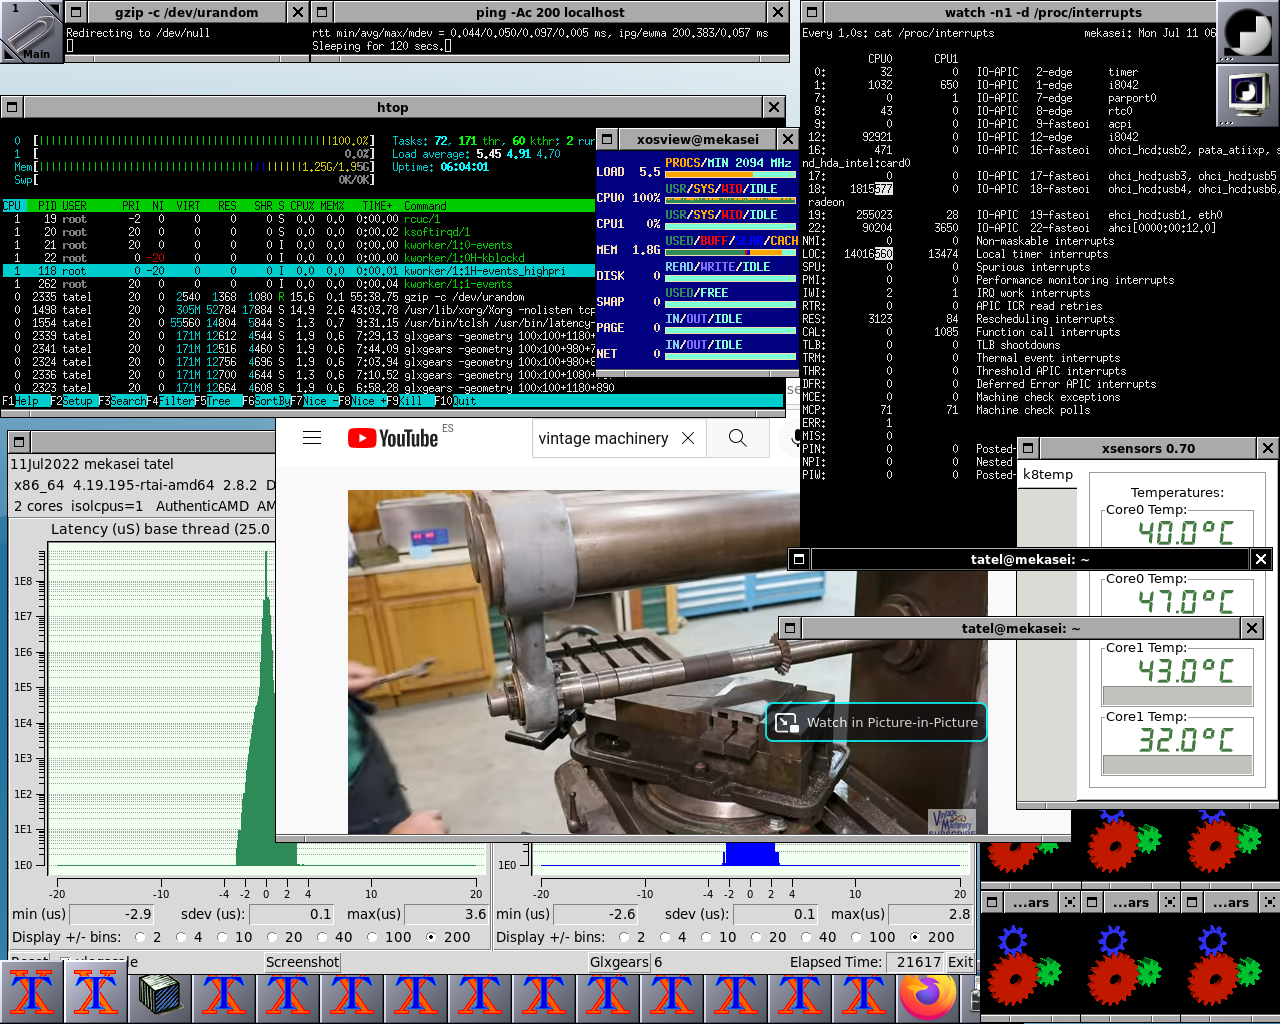
Here's the picture from yesterday's post
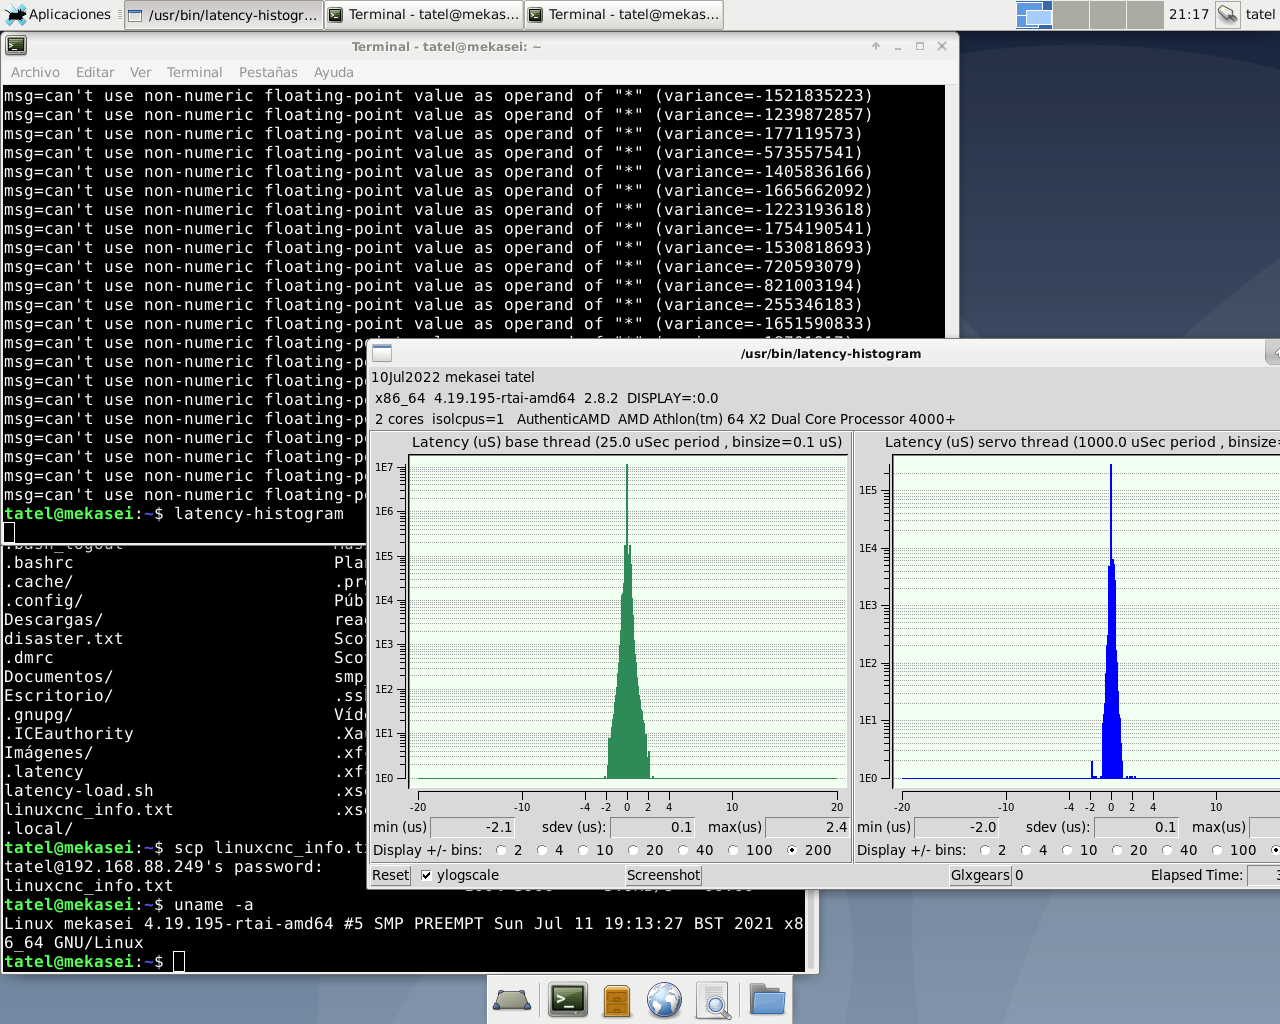
Here it is dmesg output, it turns out that there is an overrun reported, but latency-histogram did say nothing about it. It correspond to the first picture in this post, that test is still running with reported max latency 3.6 usecs
Not really sure about how to upload pictures to this forum, do you mean to attach them? Well I'm going to try ...
Here's the picture from yesterday's post
Here it is dmesg output, it turns out that there is an overrun reported, but latency-histogram did say nothing about it. It correspond to the first picture in this post, that test is still running with reported max latency 3.6 usecs
Last edit: 11 Jul 2022 05:41 by tatel. Reason: attach dmesg output
Please Log in or Create an account to join the conversation.
- andypugh
-

- Offline
- Moderator
-
Less
More
- Posts: 19886
- Thank you received: 4645
16 Jul 2022 10:47 #247443
by andypugh
Replied by andypugh on topic random fails on latency tests
The error message is from somewhere around here:
github.com/LinuxCNC/linuxcnc/blob/98a847...ts/latency-histogram
I don't know Tcl at all, but it seems that the "hal getp" is returning a non-numeric string, so perhaps add a "puts" command in that area to see what is being returned into the calculation of variance.
(As Tcl is interpreted rather than compiled, you can just edit and run)
Though, after typing this, I found forum.linuxcnc.org/38-general-linuxcnc-q...-gets-error-messages
The following user(s) said Thank You: tatel
Please Log in or Create an account to join the conversation.
- tatel
- Offline
- Junior Member
-
Less
More
- Posts: 33
- Thank you received: 16
17 Jul 2022 23:21 #247607
by tatel
Replied by tatel on topic random fails on latency tests
It seems I was getting negative variance values. Not sure why it looked random to me. After quite a bunch of tests, I drew these conclusions:
a) 2.8-rtpreempt seems to be more than good enough to get a Mesa card working perfectly. So I can fully understand why this is the chosen way to go ahead, and will probably take it, if/when I go with servos/Mesa cards in the future
b) rt-preempt isn't even near to be enough to work with the parallel port, unless a quad-core computer is available. In that case, some 15-20 usecs latency could be expected using isolcpus=1,2,3 and a boot line longer than the police record of the entire Capone gang. Without isolcpus= on the boot line, better to forget about it.
That's what I was getting much more easily from a dual core and 2.7-rt. With 2.8-rtpreempt, I was anyway getting overruns for a 50000 ns base thread as soon as latency-histogram gets over 30 usecs, give or take a bit.
c) Maybe cpuset is the way to go, maybe not. I don't know, but since it seems that the rt-preempt kernel still has more latency than I want for my stepper drives, I'm not going to explore it
d)2.8-rt is much better latency-wise, and I got some 3-4 usecs latency after a 24-hours test with it, using isolcpus. However it looked to me as if cpuset and cpu hotplug were disabled, so no chance to play with cpuset. Also, it seems to be more fragile than its predecessor, hence the messages gotten from latency-histogram, be it about variance, be it about waiting for "thread" component, etcaetera
e) 2.7-rt is the way to go for me. I'm getting 1-2 usec base latency very easily on the very same computer that gives 3-4 usec with 2.8-rt and 30-50 with 2.8-rtpreempt. Without any bizarre behavior. I don't care about Debian Wheezy being unmaintained, all I want is a computer able to manage those pesky sherline drivers that need a 22 usec signal to make a step. I'm not planning to do anything else with it but to cheaply control steppers.
Anyway, kudos to the linuxcnc community for the good work done, and thanks to you all who answered my messages.
Please Log in or Create an account to join the conversation.
- tommylight
-
- Away
- Moderator
-
Less
More
- Posts: 21764
- Thank you received: 7438
18 Jul 2022 00:46 #247615
by tommylight
With RT kernel 4.9 a base period of 40000 and with 5.18 a base period of 60000 never fail. Just needs some stuff disabled in BIOS.
Replied by tommylight on topic random fails on latency tests
Not always, Dell Optiplex 980 work perfectly well with RT kernel and nothing added to grub.
b) rt-preempt isn't even near to be enough to work with the parallel port, unless a quad-core computer is available. In that case, some 15-20 usecs latency could be expected using isolcpus=1,2,3 and a boot line longer than the police record of the entire Capone gang. Without isolcpus= on the boot line, better to forget about it.
With RT kernel 4.9 a base period of 40000 and with 5.18 a base period of 60000 never fail. Just needs some stuff disabled in BIOS.
Please Log in or Create an account to join the conversation.
- tatel
- Offline
- Junior Member
-
Less
More
- Posts: 33
- Thank you received: 16
08 Aug 2022 07:37 #249328
by tatel
Replied by tatel on topic random fails on latency tests
Well, I think it's surely related to a trace I'm getting on dmesg output. I'm getting it when using isolcpus=1 in the boot line and launching latency-histogram without taskset. Launching with taskset, no trace and no problem. I doesn't matter if taskset sets the affinity either to 1, 2 or even 1,2, trace just not happens.
From the trace, I'm pretty sure it's related to the integrated NIC, a Tigon tg3, since it's the only hardware reported as PCI-MSI. It seems to me that the kernel is having some problem setting the smp affinity for that interrupt. Using pci=nomsi on the boot line makes the NIC appear as IO-APIC, yes, but latency-histogram continues to behave the same way. Blacklisting tg3 module doesn't solve the problem, either. Since SYSINFO line says CLOCK NAME: 'tsc' but dmesg says "Clocksource: Switched to clocksource hpet", I also tried setting Clocksource=hpet on the boot line. Didn't worked.
When getting the trace, sometimes latency-histogram works as expected. If not, latency-histograms takes some seconds to start and min latency shows negative values of -24,7 and -999,7 on base and servo threads respectively, then it throws those variance errors, and you get an overrun in dmesg. Latency-test shows values in that ballpark, but as positive latency. Latency-plot doesn't get it anyway, it just shows low latency values. Linuxcnc itself, well, right now I started it with the axis simulator half a dozen times. Launched from xterm window. No taskset used. Seems to be working fine. No traces, no overruns reported, neither on the GUI, nor on the xterm, nor on dmesg output.
Funny enough, you don't always get that trace, even if not using taskset. Chance to not getting it seems higher after some tests. But after a restart, you can be pretty sure to get it, unless using taskset (or not using isolcpus=) However, without isolcpus on the boot line, latency is bad. Latency-test has the same kind of behaviour, you can get the trace, or not, but it seems to be managing it better since latency values reported are always positive. You can get the trace but get no problem sometimes, like it happens with latency-histogram. Latency-plot, as said, always gives positive, low latency values "only", even with trace and initial overrun on dmesg. Linuxcnc itself seems to behave better, but if memory serves me well, I have seen initial overruns reported on dmesg, but not reported on the GUI. That did not happen last time, however.
Well, I can work around this randomly happening error using taskset, even if latency is worse. But it seems worth to report it.
Have a nice day.
PS: Here's the trace excerpt from dmesg:[ 83.573702] elogind-daemon[1378]: New session c1 of user tatel.
[ 99.888347] I-pipe: head domain RTAI registered.
[ 99.888460] WARNING: CPU: 0 PID: 1611 at arch/x86/kernel/apic/msi.c:106 msi_set_affinity+0x120/0x150
[ 99.888461] Modules linked in: rtai_hal(+) snd_hda_codec_hdmi snd_hda_intel snd_hda_codec radeon ttm drm_kms_helper drm snd_hda_core hp_wmi snd_hwdep sparse_keymap rfkill snd_pcm wmi_bmof snd_timer snd drm_panel_orientation_quirks i2c_algo_bit evdev fb_sys_fops syscopyarea sysfillrect sysimgblt pcspkr serio_raw edac_mce_amd soundcore k8temp wmi button ext4 crc32c_generic crc16 mbcache jbd2 fscrypto sg sd_mod psmouse i2c_piix4 ohci_pci floppy ahci libahci libata scsi_mod tg3 libphy ehci_pci ohci_hcd ehci_hcd usbcore
[ 99.888474] CPU: 0 PID: 1611 Comm: insmod Tainted: G W 4.19.195-rtai-amd64 #5
[ 99.888475] Hardware name: Hewlett-Packard HP Compaq dc5850 Microtower/3029h, BIOS 786F6 v01.09 04/09/2008
[ 99.888476] I-pipe domain: Linux
[ 99.888476] RIP: 0010:msi_set_affinity+0x120/0x150
[ 99.888477] Code: 83 c7 20 c1 e7 04 ff 50 18 0f a3 e8 73 0a 48 8b 43 18 48 89 df ff 50 60 48 83 c4 08 44 89 e0 5b 5d 41 5c 41 5d 41 5e 41 5f c3 <0f> 0b 48 89 ee 48 89 df e8 e3 fd ff ff eb df 65 48 c7 04 d5 20 41
[ 99.888478] RSP: 0018:ffffc90000177bb8 EFLAGS: 00010297
[ 99.888479] RAX: 0000000000000000 RBX: ffff88807c84c828 RCX: 0000000000000000
[ 99.888480] RDX: ffff88807c84c800 RSI: 0000000000000037 RDI: 0000000000000000
[ 99.888481] RBP: ffff888079e08440 R08: 0000000000000000 R09: 0000000000000000
[ 99.888482] R10: 0000000000000040 R11: 0000000000000000 R12: 0000000000000000
[ 99.888482] R13: ffffc90000177bf8 R14: 0000000000000001 R15: ffff888079e089c0
[ 99.888483] FS: 00007ff87fc1c4c0(0000) GS:ffff88807da00000(0000) knlGS:0000000000000000
[ 99.888484] CS: 0010 DS: 0000 ES: 0000 CR0: 0000000080050033
[ 99.888485] CR2: 00007fd540ded0b0 CR3: 000000007aea1000 CR4: 00000000000006f0
[ 99.888485] Call Trace:
[ 99.888486] ? irq_msi_compose_msg+0x50/0x50
[ 99.888486] ? ipipe_set_irq_affinity+0x78/0xa0
[ 99.888487] ? rt_assign_irq_to_cpu+0x6e/0xa0 [rtai_hal]
[ 99.888488] ? __rtai_hal_init+0x1ec/0x220 [rtai_hal]
[ 99.888489] ? rt_free_timers+0x40/0x40 [rtai_hal]
[ 99.888489] ? do_one_initcall+0x3f/0x170
[ 99.888490] ? free_unref_page_commit+0x8a/0x100
[ 99.888490] ? kmem_cache_alloc+0x80/0xf0
[ 99.888491] ? do_init_module+0x50/0x1f0
[ 99.888492] ? load_module+0x1b07/0x1cf0
[ 99.888492] ? __do_sys_finit_module+0x96/0xb0
[ 99.888493] ? __do_sys_finit_module+0x96/0xb0
[ 99.888494] ? do_syscall_64+0x59/0x1e0
[ 99.888494] ? __ipipe_trap_prologue+0xef/0x210
[ 99.888495] ? entry_SYSCALL_64_after_hwframe+0x44/0xa9
[ 99.888496] ---[ end trace 3f6c88e031e59fea ]---
[ 99.888568] RTAI[hal]: mounted. ISOL_CPUS_MASK: 2.
[ 99.888571] SYSINFO - # CPUs: 2, TIMER NAME: 'lapic', TIMER IRQ: 4355, TIMER FREQ: 12466489, CLOCK NAME: 'tsc', CLOCK FREQ: 2293835000, CPU FREQ: 2293835000, LINUX TIMER IRQ: 4355.
[ 99.947127] RTAI[malloc]: global heap size = 2097152 bytes, <BSD>.
[ 99.947164] kstacks pool size = 524288 bytes
[ 99.947165] RTAI[sched]: hard timer type/freq = lapic/12466489(Hz)
[ 99.947166] linear timed lists.
[ 99.947167] RTAI[sched]: Linux timer freq = 250 (Hz), TimeBase freq = 2293835000 hz.
[ 99.947168] RTAI[sched]: timer setup = 80 ns, resched latency = 0 ns.
[ 100.007461] USERMODE CHECK: OK.
[ 100.007465] USERMODE CHECK PROVIDED (ns): KernelLatency 741, UserLatency 968.
[ 100.007467] FINAL CALIBRATION SUMMARY (ns): KernelLatency 741, UserLatency 968.
[ 100.036909] RTAI[math]: loaded, using musl libm.
Please Log in or Create an account to join the conversation.
- andypugh
-
- Offline
- Moderator
-
Less
More
- Posts: 19886
- Thank you received: 4645
17 Aug 2022 23:52 #249982
by andypugh
Replied by andypugh on topic random fails on latency tests
Is this problem on launching LinuxCNC? (I know that there is an occasional problem _quitting_ LinuxCNC)
Please Log in or Create an account to join the conversation.
- andypugh
-
- Offline
- Moderator
-
Less
More
- Posts: 19886
- Thank you received: 4645
18 Aug 2022 00:02 #249984
by andypugh
Replied by andypugh on topic random fails on latency tests
And, what is the actual error? It seems like things are carrying on through?
What you show there is very much RTAI based, and that is a separate project to LinuxCNC. It is possible that you might get more help from them?
What you show there is very much RTAI based, and that is a separate project to LinuxCNC. It is possible that you might get more help from them?
Please Log in or Create an account to join the conversation.
- tatel
- Offline
- Junior Member
-
Less
More
- Posts: 33
- Thank you received: 16
18 Aug 2022 02:45 #249995
by tatel
Replied by tatel on topic random fails on latency tests
Yep. Launching it.
After trace call, it looks to me there's a problem setting a MSI message to set smp_affinity. Trace call always happens if using isolcpus=. Sometimes latency-histogram gets through it unscathed. Other times it gets stuck at start, then shows very high negative jitter values, then it spits truckloads of messages about variance errors. Then I can see an overrun reported on dmesg output. Same with latency-test, but when it gets stuck at the start, it displays jitter values as positive. Latency-plot and, IIRC, linuxcnc, remain always unaware.
I'm working around it by launching with "taskset 2" so I need no help. Just reporting it. I agree it's RTAI-related. Yet I think all latency-histogram, latency-plot and linuxcnc should be aware of the overrun if/when it happens. I will think about reporting it to RTAI developers. Not really willing to go into yet another mailing list. But i'll probably do it after all.
With taskset 2 jitter goes from about 3 to about 12. Still good enough.
Kernel 3.4.9-rtai behaves correctly. It shows no MSI devices, so it could be a bug in 4.19.195 or a buggy BIOS, I don't know. MSI device is an integrated Tigon tg3 NIC.
Please Log in or Create an account to join the conversation.
Time to create page: 0.403 seconds