Jason
Running LinuxMint xfce 64bit with Rt-preempt kernel
Setup as in post:
forum.linuxcnc.org/forum/9-installing-li...-help?start=80#66528
This is with grub parameters:
quiet splash lapic noxsave -original paramters- intel_idle.max_cstate=0 processor.max_cstate=0 isolcpus=1 acpi_irq_nobalance noirqbalance
When first starting latancy plot I get a spike that is the red b.max in screenshot pic of latancy plot. I took screen shots just as large file write started and finished. As you can see while transfer was taking place CPU usage was 100% for both CPU's after transfer CPU1 is still carrying quit a load CPU2 load dropped to 0%. Latency stayed low during test, (below 10000us) this was done with 4 instances of glxgears, Firefox open on wired connection, music playing in repeat mode, file manager open with large file write, (6.6GB) to hard drive. From what I have read this is the behavior that is correct maybe someone else can pipe in if I am incorrect. I will let latancy histogram run the rest of the day while I am at work and add screen shot when I get home to this post.


Learned something just before walking out the door for work. Was using Totem media player for music it had failed with streaming error and no sound. Closed Totem and used VLC media instead then reset Histogram. When resetting histogram latency spike due to reset was only 15000us which original spike when starting Histogram program was 67000us.
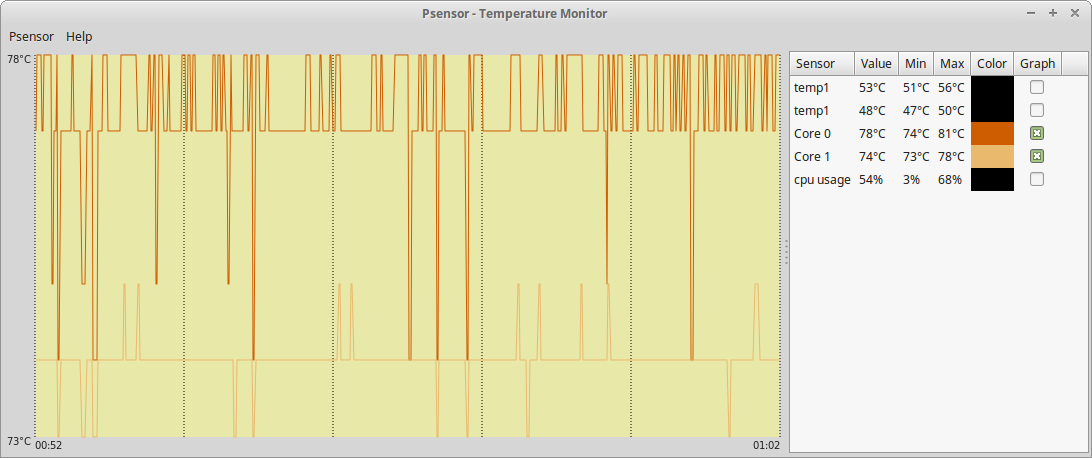
Been about 11 hours of run time included screen shot of histogram and psensor which is set to monitor CPU temp.
Max of 66800us over a 11 hour period CPU0 around 80C CPU1 about 74C
That was holding CPU0 at over 90% load for a long time
Sound had also stopped again no error on screen VLC play was still running music
If someone could chime in and explain histogram
off-chart pos bin ct
It is something else than what I thought it was