@Arciera,
For me it's not entirely clear how the probing flow is done, didn't look at is so far.
We will not invest time in it for now, exclude it for now.
@Julian,
While probing its also important to have predictable decceleration distances.
I don't get it.
Im not sure where to place my thoughts. So maybe its wrong in this thread.
Your thoughts are welcome. image missing /media/kunena/emoticons/wink.png
Edit:
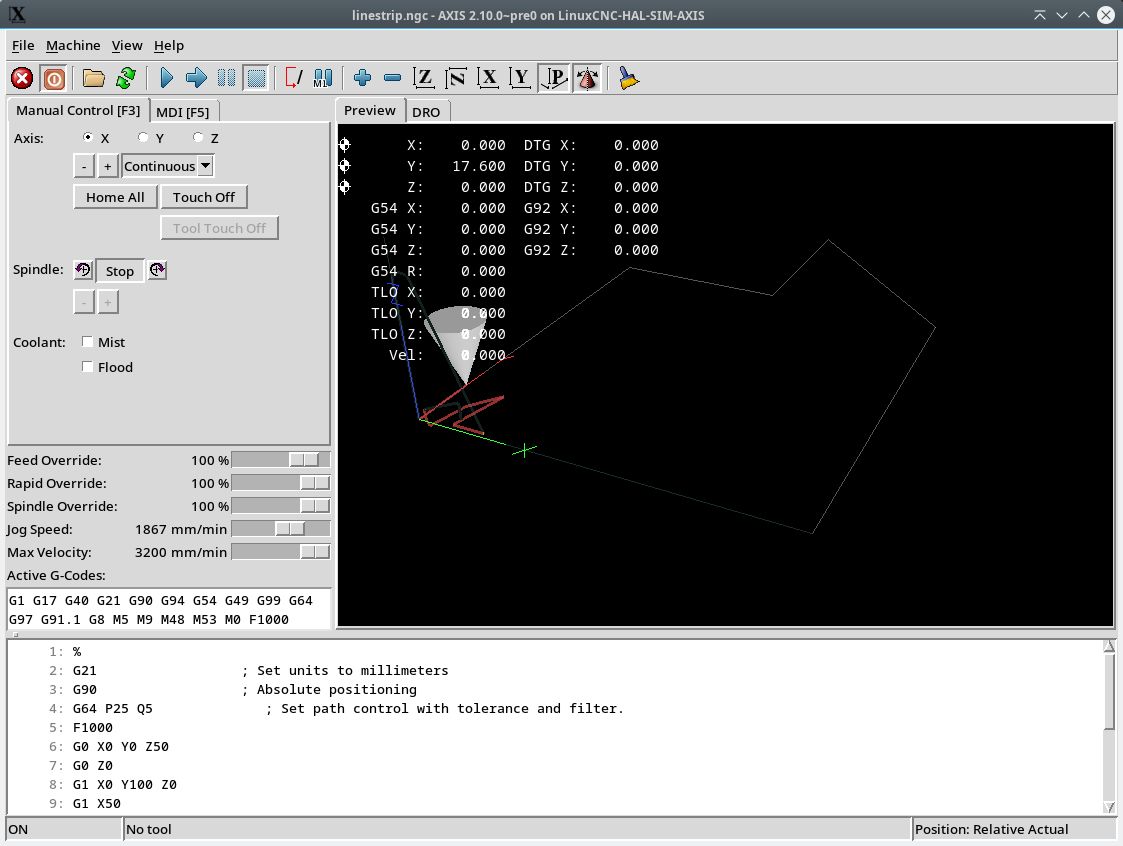
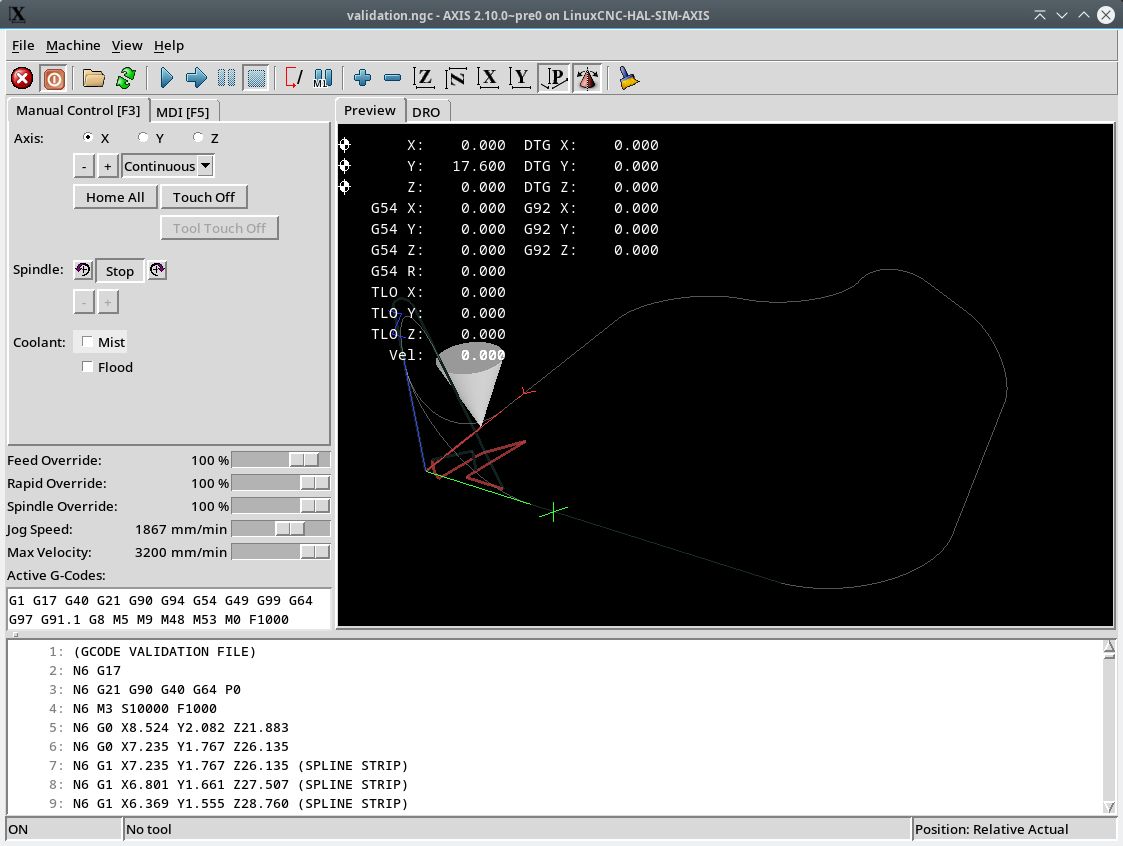
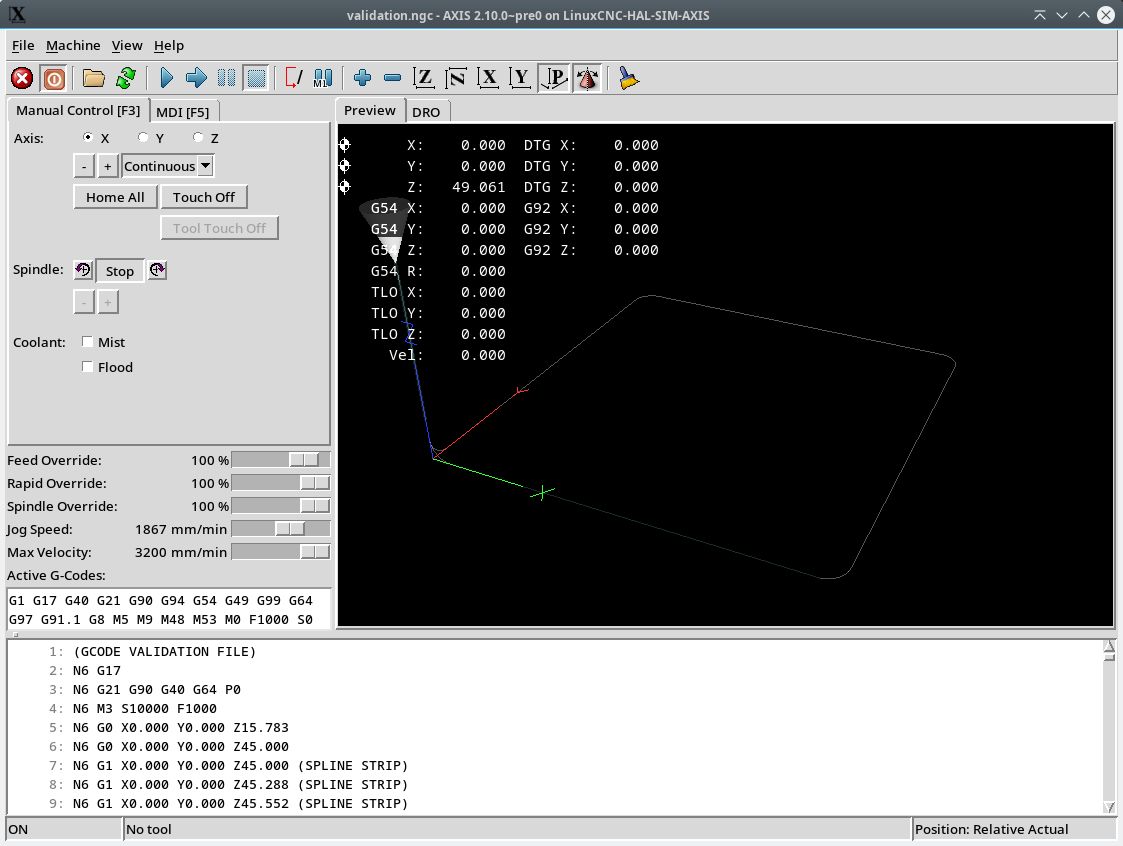
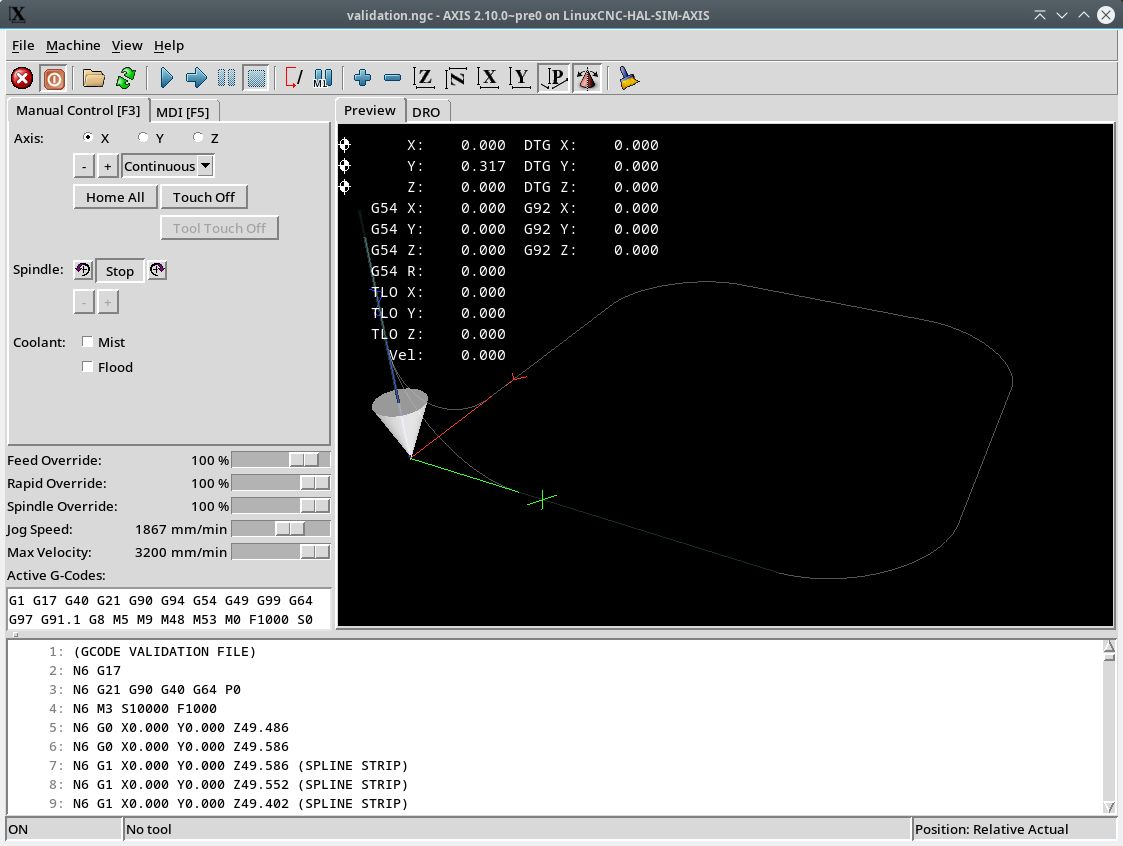
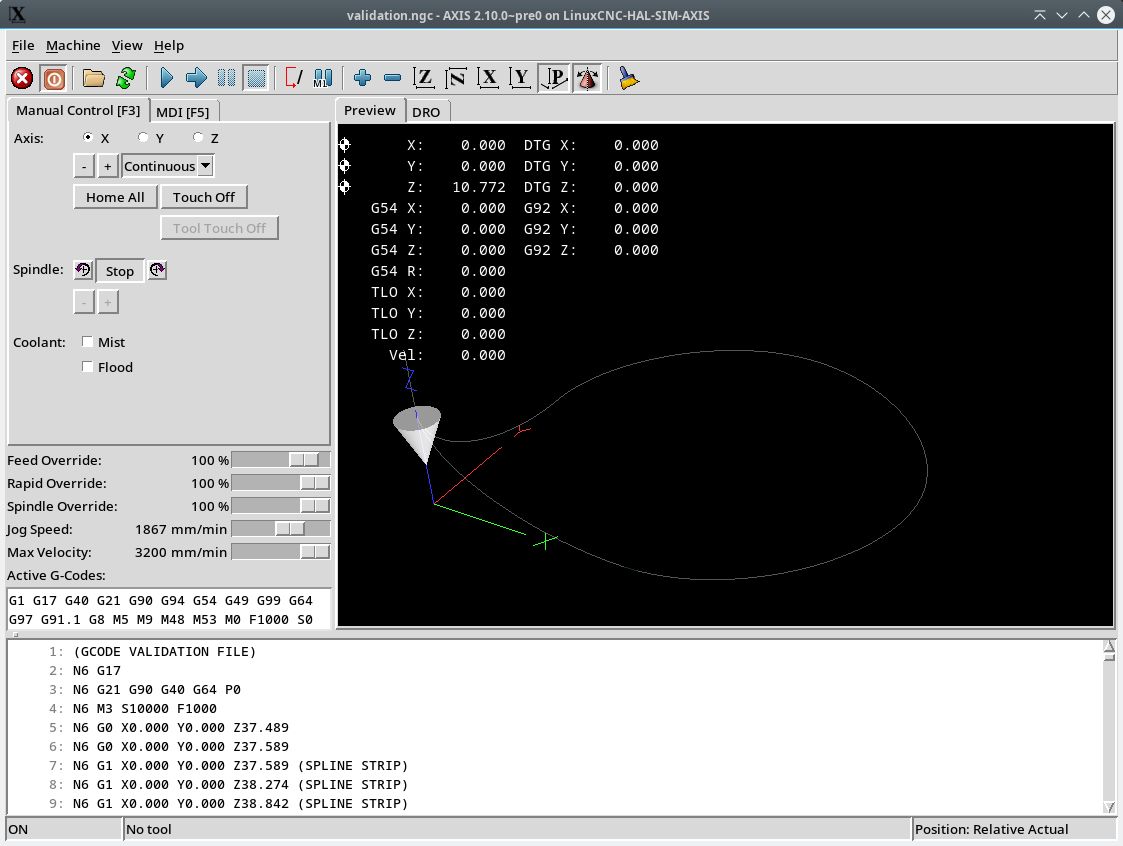
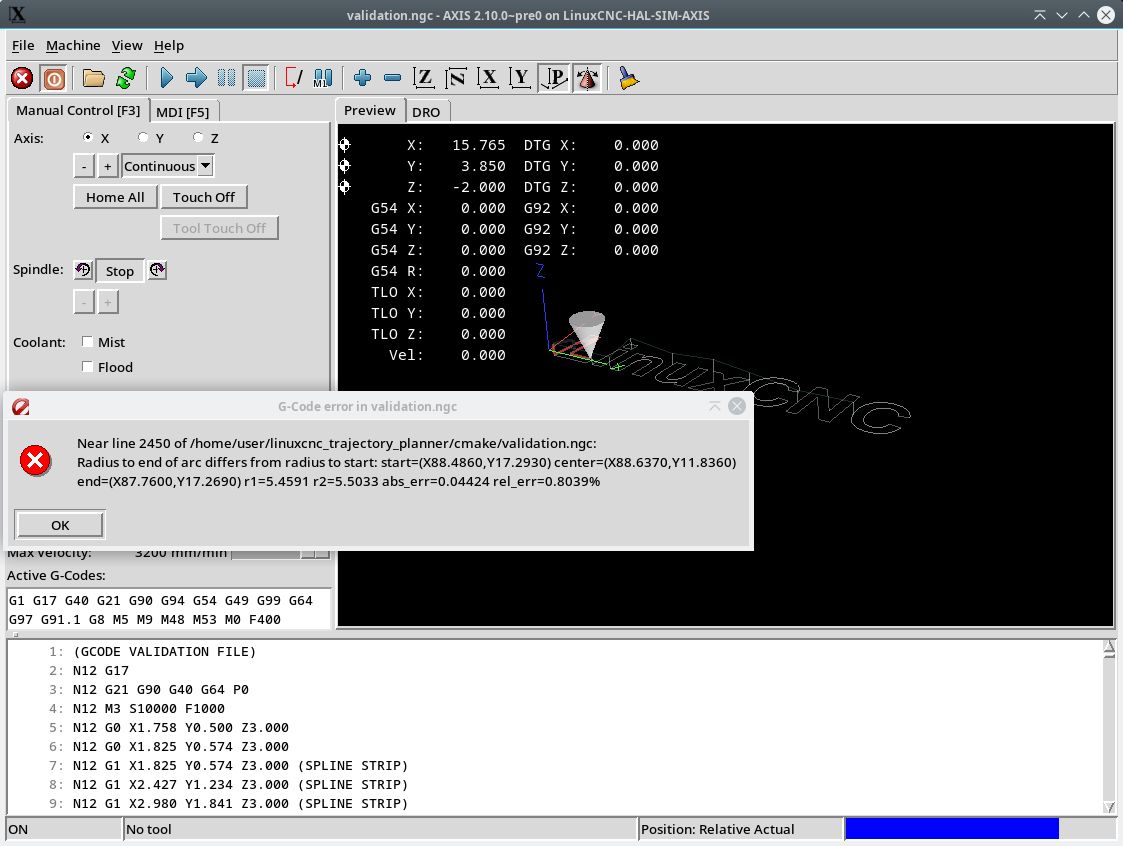
We are now at the stage that the trajectory is filletized with 3d bspline's. image missing /media/kunena/emoticons/ermm.png
For the 3d bspline's i used a lib called
tinyspline
, image missing /media/kunena/emoticons/w00t.png instead of linking to the huge opencascade lib. image missing /media/kunena/emoticons/blink.png
Ok next step should ideally be visualizing the trajectory including the fillet result. But how?
We didn't coded the plannet yet. And the original planner can not run the fillets.
1. For this i could create a tiny
tpmod_viewer.so component (helper component) wich draws the yellow toolpath line over the gcode path.
2. Modify the original planner, to also run spline fillets. This includes logic to reload the lcnc gcode queue at runtime. More difficult.
3. Create a text file output with trajectory points every mm to load into a external online viewer.
What should we do? Any thoughts about validating the filletized trajectory path?